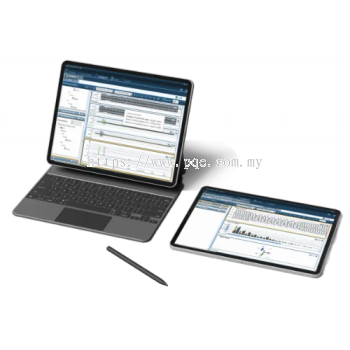
DATA VISUALIZATION
PQE Power Quality Analysis Software offers numerous ways to visualize data from the aquired COMTRADE file. The software’s extensive charts capabilities include:
-
Trend chart - View electrical parameters for a selected time range as one or more graphs

-
Spectrum chart -
-
Statistical chart - View selected parameters for a selected time range

-
Scatter Event chart - View events for a selected time range according to standards or custom definition (such as CBEMA)

-
Scatter Parameter chart - View scattered dots of a specific parameter in relation to another parameter

-
Summary chart
-
Grid chart
-
Phasor chart - View the phasor’s amplitude and angle for a selected time range

-
Energy chart - View Energy data of multiple points for selected time frame

-
Cyclic Histogram chart - The X and Y axes make up a given number of bins for Z values to be established. As a given X sample is selected, the Y value is measured and placed in the corresponding bin as a percent, which is derived from one sample divided by total samples in the T measurement period.

DATA COMPUTATION
PQE Power Quality Analysis Software will automatically calculate and store ~5,000 power parameters at a resolution of ½ cycles, 10/12 cycles, 150/180 cycles, 10 min and 2 hours of which, any given resolution is calculated for display and reporting purposes from acquired waveform signals (COMTRADE file).


