请登录后使用此功能。 您可以使用此功能将商品添加到您的收藏列表。
关闭
您已经添加该商品到您的收藏列表。 查看我的收藏
关闭
从您收藏列表中删除此商品。
关闭
请登录后使用此功能。 您可以使用此功能将公司添加到您的收藏夹列表。
关闭
这家公司已成功添加。 查看我的收藏
关闭
这家公司已从你的收藏夹列表中删除。
关闭
请登录后使用此功能。 您可以使用此功能将公司添加到您的询问车。
关闭
这家公司已被添加到您的询问车。
关闭
这家公司已从询价车中删除。
关闭
该商品已被添加到您的询问车。
关闭
该商品已经从您的询价车中删除。
关闭
商品/公司已达到添加至询价车的数量。
关闭
PQE Power System Sdn Bhd
PQE Power System Sdn Bhd 201101000920 (929054-P)
营业
时间
星期一 - 星期五 9:00 AM - 6:00 PM
星期六 - 星期日 休息
营业 休息
SSM

20-Jun-2023

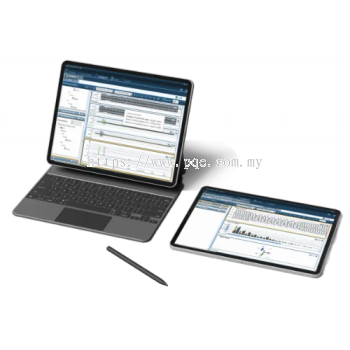
DATA VISUALIZATION

PQE Power Quality Analysis Software offers numerous ways to visualize data from the aquired COMTRADE file. The software’s extensive charts capabilities include:

  • Trend chart - View electrical parameters for a selected time range as one or more graphs

Example of three trend charts (3 phases voltage RMS, 3 phases voltage waveform, and 3 phases current waveform) on a single view. The charts display voltage interruption of 400 milliseconds.
 

  • Spectrum chart - 


  • Statistical chart - View selected parameters for a selected time range

example of a statistical chart for frequency. both cumulative and relative statistics are available on the same chart.
 

  • Scatter Event chart - View events for a selected time range according to standards or custom definition (such as CBEMA)

Example of ITIC chart. This chart displays power quality events. Events of the chart are clickable.
 

  • Scatter Parameter chart - View scattered dots of a specific parameter in relation to another parameter

example of scatter chart. this chart plots Reactive power Vs Active power
 

  • Summary chart

  • Grid chart

  • Phasor chart - View the phasor’s amplitude and angle for a selected time range

example of phasor chart
 

  • Energy chart - View Energy data of multiple points for selected time frame

example of stacked bar char for energy analysis
 

  • Cyclic Histogram chart - The X and Y axes make up a given number of bins for Z values to be established. As a given X sample is selected, the Y value is measured and placed in the corresponding bin as a percent, which is derived from one sample divided by total samples in the T measurement period.

Example of normalized Cyclic Histogram chart

DATA COMPUTATION


PQE Power Quality Analysis Software will automatically calculate and store ~5,000 power parameters at a resolution of ½ cycles, 10/12 cycles, 150/180 cycles, 10 min and 2 hours of which, any given resolution is calculated for display and reporting purposes from acquired waveform signals (COMTRADE file).

5 K Parameters icon


发信息至 PQE Power System Sdn Bhd
谢谢您的询问!
我们的客服会尽快联络您。
您的名字 *
您的公司名字
您的邮件 *
您的联络号码 *
标题 *
信息 *
验证码 *
总办事处

PQE Power System Sdn Bhd 201101000920 (929054-P)
C-10-01, Oasis Square, Jalan PJU 1A/7A, Ara Damansara, 47301 Petaling Jaya, Selangor, Malaysia.

邮件:
网址: https://www.pqe.com.my
网址: https://pqe.newpages.com.my/
网址: https://pqe.n.my/

游览 : 首页 - 分类 - 公司 - 地区 - 标签 - 商品 - 消息与促销 - 工作征聘 - 手机版 - 谷歌 - 搜索引擎优化结果

NEWPAGES

  • US 14157
  • VN 13624
  • GB 10706
  • CA 9621
  • AU 9263
  • IE 5388
  • NZ 4407
  • BR 4005
人 在线
Seni Jaya Logo
Brochure
Download
Our PackageContact Us